Readability Standards for High-Conversion Landing Pages
Simple language nearly doubles conversion rates on landing pages.
Readability Standards for High-Conversion Landing Pages.
Landing page readability is the conversion lever most teams skip
Reading level, sentence length, and word choice separate high-converting landing pages from average ones more consistently than almost any other variable, and most teams never put them on the list. Conversion rate optimization tends to chase button color, page layout, and how many fields sit in the form, while the actual words on the page get a pass once someone on the team feels good about the copy, which gets the priorities backwards. That's backwards, and the data on it isn't close.
Consider the spread already sitting in the numbers. The median dedicated landing page converts at 6.6%, based on Unbounce's Conversion Benchmark Report, which drew on 57 million conversions across 41,000 pages Unbounce 2024 Conversion Benchmark Report. The top 25% of SaaS pages clear 11.6% or better Unbounce 2024 Conversion Benchmark Report. That gap, nearly double, exists between pages targeting the same traffic, the same offers, often the same industry. Something in that gap is systematic, and copy-level decisions are a big part of it Unbounce 2024 Conversion Benchmark Report.
What makes the readability argument worth taking seriously isn't a handful of A/B tests from one agency's blog. It's analysis at scale, across tens of millions of conversions, with academic research backing up the pattern independently. The rest of this piece breaks down what "readability" actually means once you get specific: reading level, headline construction, body copy length, and the typographic details that decide whether readable copy gets read on a screen.
What the conversion data says about reading level
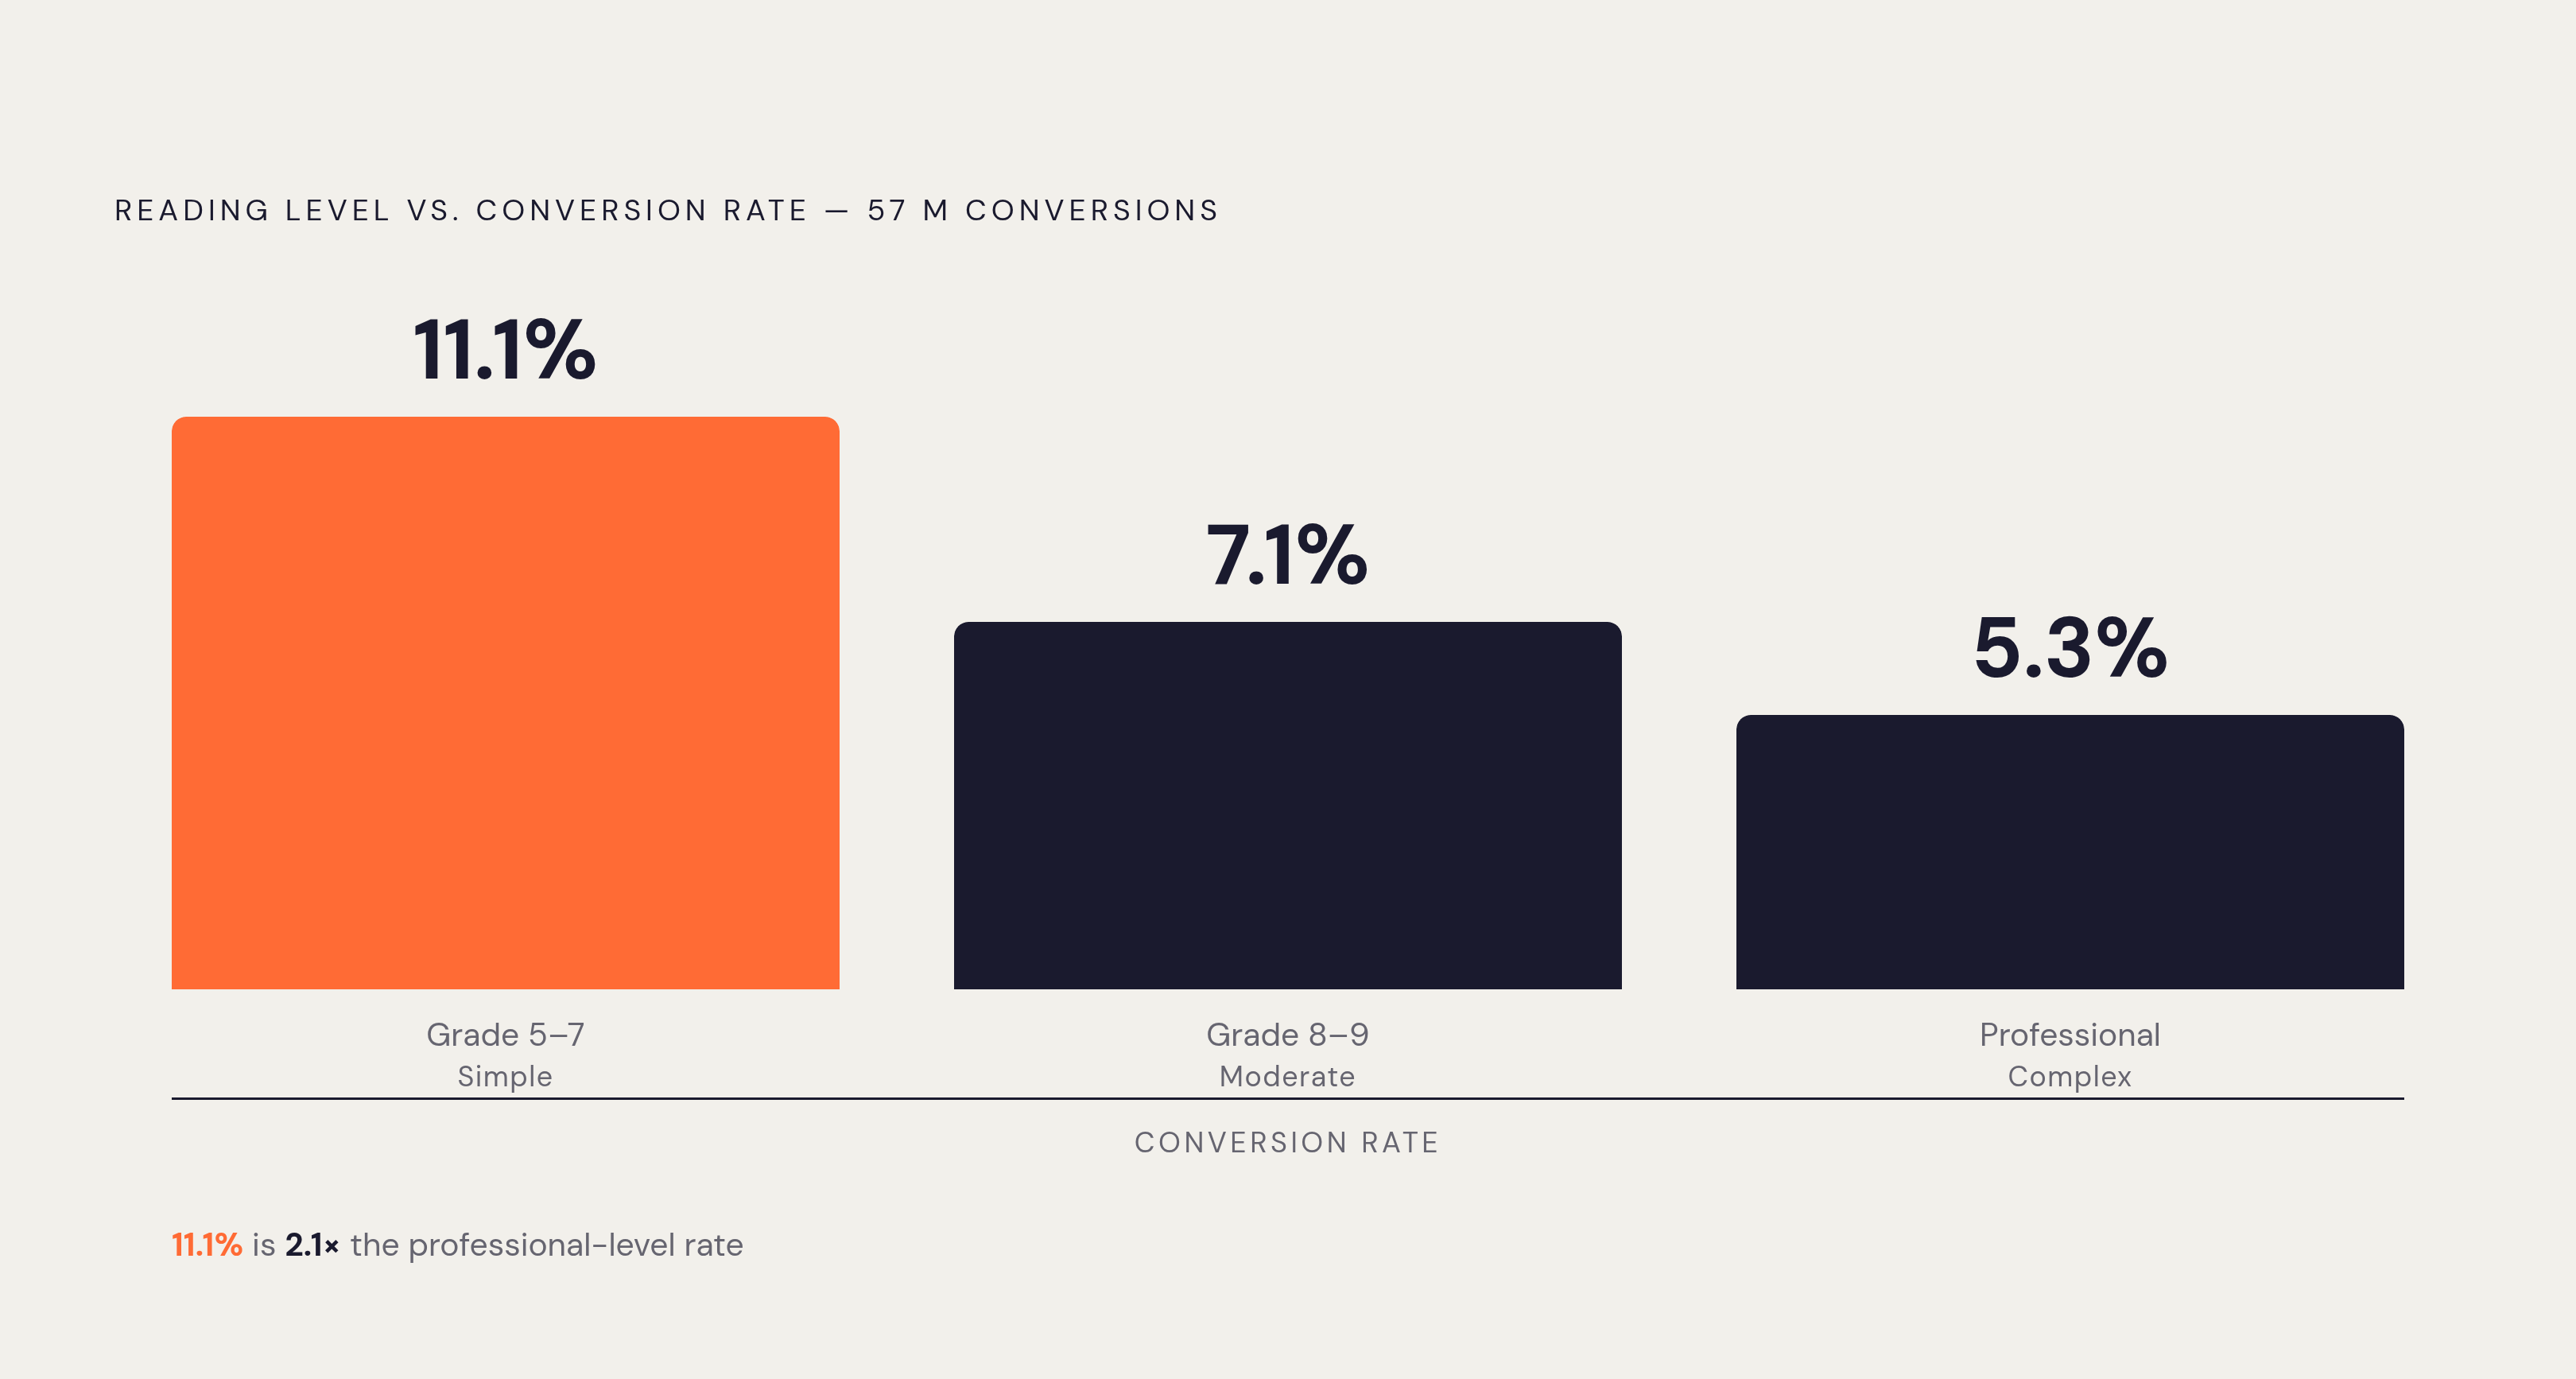
Start with the headline number, because it's the whole argument in one line. Unbounce's report finds that copy written at a 5th-to-7th-grade reading level converts at 11.1%, compared with 7.1% for 8th-to-9th-grade copy and 5.3% for copy written at a professional level Unbounce 2024 Conversion Benchmark Report. That's a 56% lift over the middle tier and better than double the rate of the most polished, most "professional" writing on the list Unbounce 2024 Conversion Benchmark Report. Polish, in other words, is often the problem.
The education sector shows the same pattern in miniature. Simpler language, again in the 5th-to-7th-grade range, converts at 13.3% against 6.4% for complex language, close to double. And the penalty isn't holding steady. Unbounce's research found the correlation between complex words and lower conversion rates was 62% stronger in 2024 than it was in 2020 Unbounce / Kirro. Jargon used to cost less. It costs more now, and the trend line points toward it costing more still.
Separate research from Lander Lab found difficult words tied to a 24.3% drop in conversion rate, a steeper penalty than earlier Unbounce findings had shown. None of this is one firm's pet metric, either. A peer-reviewed study out of the University of Silesia in Katowice, published in Entropy in 2021, confirmed that readability indices can predict conversion rates, with the added nuance that different indices carry both positive and negative correlations depending on context Marketing LTB. Readability is a set of variables that interact. It's a set of variables that interact. Treating it as one soft, subjective judgment call (does this copy "feel" clear?) misses what the data is actually saying.
For a working reference point: aiming for 5th-to-6th-grade copy means writing something easier to parse, by Flesch score, than Harry Potter. That's a useful anchor for anyone who's never thought about writing in terms of grade level before. The Hemingway App shows up repeatedly in the literature as the practical tool for hitting that target, flagging dense sentences and suggesting simpler substitutes as you write.
Why users don't read
None of the reading-level data matters if you don't understand why it works, and the reason traces back to a behavioral fact that's been documented for two decades: people don't read web pages. They scan them. Nielsen Norman Group research puts the number at 79% of users scanning rather than reading word-by-word, with only 16% reading linearly, start to finish. That's a widespread behavior. That's nearly everyone.
The window to work with has also gotten shorter. Nielsen Norman Group's research adds a harder deadline inside that window: users leave a page within 10 to 20 seconds if it doesn't communicate a clear value proposition, and the first 10 seconds is the threshold for earning any more of their time True Future Media Marketing LTB Nielsen Norman Group / UXPin. Above the fold, the stakes get sharper still. 57% of desktop visitors and 64% of mobile visitors never scroll past the first screen Digital Applied 2026. Whatever the page needs to say, it has to say fast, and it has to say it before anyone scrolls.
This is where reading level and scanning behavior connect directly. Lower-grade copy isn't just easier to decode once someone commits to reading it; it's faster to scan in the first place, which matters more given how little reading actually happens. The two benefits are distinct mechanisms, but they reinforce each other rather than working independently.
Layout compounds the effect. Pages dense with text push readers into an F-pattern of scanning, the classic pattern where eyes track heavily down the left side and across the top, leaving anything parked in a right-hand rail (including CTAs) largely ignored. Shorter, simpler copy supports the Z-pattern that most landing pages are actually designed around, guiding the eye from headline to value proposition to call to action in a deliberate path. The F-pattern is a symptom of poor formatting. It's a symptom of poor formatting, and readable copy paired with the right structure is what prevents it from taking over. Attention spans have dropped from roughly 2.5 minutes in 2004 to 47 seconds in 2024 (the window to make copy work is narrowing) Marketing LTB Sender.net.
The top 25% of SaaS pages clear 11.6% or better Unbounce 2024 Conversion Benchmark Report.
Headline and subheadline standards that put reading level into practice
The headline carries more conversion weight than any other single line on the page, and the standards for it are specific enough to act on directly. Ten words is the ceiling: the headline needs to communicate the value proposition in under 10 words, full stop True Future Media Nielsen Norman Group / UXPin. Anything longer starts fighting the scanning behavior described above rather than working with it.
Word choice matters as much as word count. Headlines written in the reader's own vocabulary, sourced from customer interviews or mined out of product reviews, outperform marketer-written headlines by 19% Digital Applied 2026. That gap exists for a plain reason: customers describe problems in plainer, more concrete language than marketing teams do, so pulling from their words is as much a readability shortcut as it is a messaging strategy. Adding a concrete number, a percentage, a dollar figure, a time saved, outperforms vague benefit statements by 15% Digital Applied 2026. Cut onboarding time by 40%" beats "faster onboarding" on the numbers, not just on intuition (benefit-focused copy converts 20% to 40% better than feature-focused copy).
Message match, meanwhile, ranks among the strongest conversion predictors in the Unbounce benchmark data: when the landing page headline mirrors the ad that brought the visitor there, conversion improves by up to 39%. That's the largest single lift in this section, and it costs nothing but attention to the ad itself.
Framing separates winners from the rest, too. Outcome-driven H1 headlines score 58 out of 100 on average in roast.page's 2026 analysis, against 44 out of 100 for feature-driven headlines, a 14-point gap driven by one editorial choice True Future Media Nielsen Norman Group / UXPin. Yet 62% of SaaS pages still lead with a feature rather than an outcome True Future Media Roast.page Nielsen Norman Group / UXPin. That's a lot of pages leaving points on the table over a decision that takes no extra time to make correctly.
Subheadlines of 10 to 20 words convert 14% better than a one-line subhead and 22% better than a long paragraph-style one Unbounce / ZoomInfo Roast.page. Too short and the subhead does no real work. Too long and it becomes a dense block that scanning readers skip past.
Body copy length and structure: what the data supports
The instinct to say more, to explain the offer fully, to answer every objection in the body copy, runs directly against the data. Landing pages with less copy convert at 14%, against 11% for pages loaded with more copy than they need. In business services specifically, pages under 100 words convert 50% more than pages running past 500 words, the single most concrete count-based finding in the research.
That said, the exception matters and it's not small. Short copy wins for low-cost, low-commitment offers; longer copy wins when the offer is expensive or complex enough that the reader genuinely needs more information before deciding. Word count is a function of how much a reader has to weigh before saying yes.
Framing inside that copy matters just as much as its length. Benefit-focused copy converts 20% to 40% better than feature-focused copy, and the reason ties straight back to readability: features require more cognitive load to interpret than benefits do. Features cost more cognitive effort to interpret, and cognitive effort is what scanning readers won't spend.
Formatting choices function as readability tools in their own right. Bulleted benefit lists improve scanning and lift engagement by 12%. Structuring the page in an inverted pyramid, answer first, supporting detail after, works with scanning behavior instead of against it. And structural focus counts as much as copy focus: pages built around a single CTA convert 70% more than pages offering visitors multiple competing calls to action. Clutter in the layout does the same damage as clutter in the sentences.
Typography standards that make readable copy readable on screen
Every reading-level improvement described so far collapses if the type itself is hard to see. Grade level doesn't matter if the words are too small to parse comfortably, which makes typography the delivery mechanism for everything above it, not a separate concern layered on top.
Size sets the floor. Dropping below 16px on body copy causes readers to be lost, older audiences especially.
Line length has its own tested range. Going outside that band in either direction causes the eye to start tracking in a way that interrupts reading flow rather than supporting it.
Contrast is the one item on this list with no room for judgment calls: WCAG 2.1 AA sets 4.5:1 for body text and 3:1 for large text, and that's a baseline, not a suggestion. Responsive behavior matters too. WCAG requires text to resize up to 200% without breaking the layout, and relative units like em and rem are built to handle that.
On the question of serif versus sans-serif, the research doesn't support a strong preference either way for general audiences; well-designed fonts in either category read about the same, though accessibility considerations for specialized audiences tend to favor sans-serif. The debate is largely settled. The choice is contextual.
Hierarchy ties all of this together. Varying size, weight, and style across headings, subheadings, body text, and CTAs is what actually makes Z-pattern scanning possible. Without that hierarchy, readers fall back into the F-pattern by default, no matter how good the copy underneath it is. And positioning has its own bias to respect: Nielsen Norman Group's eye-tracking data, cited by Smashing Magazine, shows users spend the majority of their viewing time on the left half of a page, which is exactly where the most important keywords and CTAs belong. Line height: headings 1.0–1.35; body text at least 1.5; a practical starting range of 1.45–1.7 for body copy, adjusted for typeface and measure.
Putting the framework together: a prioritized readability checklist for landing pages
Fixing typography before fixing reading level gets the order backwards. Reading level is the highest-leverage variable on this entire list, copy length and structure come second, and typography, while non-negotiable, delivers both of those elements rather than driving them. Polishing the font before fixing the grade level of the sentences leaves the largest gains sitting on the table, unclaimed.
Start with an audit. Paste the current copy into the Hemingway App or an equivalent tool, target a 5th-to-7th-grade output, and flag every sentence that reads above 8th grade for a rewrite. From there, pull vocabulary straight from customers: reviews, support tickets, and interview transcripts, since marketer-written headlines already lag customer-language headlines by 19%. Tighten the headline itself to under 10 words, built around an outcome rather than a feature, ideally with a concrete number attached, and matched to whatever ad brought the visitor to the page in the first place.
Next, right-size the body copy to the offer. Low-cost or simple offers should default to under 100 words in the key sections; higher-cost offers can justify more length, but benefit-first framing applies regardless of price point. Format everything for scanners rather than readers, using bullets, inverted pyramid structure, generous white space, a single CTA, and no navigation menu competing for the exit.
A short list of tools covers most of this workflow: the Hemingway App for copy, roast.page's audit methodology for headline scoring, and a WCAG contrast checker for accessibility. Platforms that let teams implement and A/B test copy changes without engineering support also belong in the stack, such as a tool like Unbounce or a conversion-focused copywriting platform.
The gap sits between a page converting at 5.3%, written at a professional register, and one converting at 11.1%, written at a 5th-to-7th-grade level. That gap has nothing to do with design polish, ad budget, or traffic quality. It comes down to the reading level of words that are, in most cases, already sitting on the page, waiting to be rewritten. Step 6 (Audit typography against the standards): body text at or above 16px, line length 45–90 characters, line height at least 1.5 for body, contrast at WCAG AA minimum.
Sources
- What's a good conversion rate? (Based on 41,000 landing pages)
Provided the core conversion rate data including the 57-million-conversion dataset, grade-level reading benchmarks (11.1%, 7.1%, 5.3%), and the SaaS top-quartile figure of 11.6%.
- Conversion Rate Prediction Based on Text Readability Analysis of Landing Pages
Supplied the peer-reviewed University of Silesia study confirming that readability indices predict conversion rates with both positive and negative correlations depending on context.
- Landing Page Conversion Rate Benchmarks by Industry [2026 Data]
Provided the finding that difficult words are tied to a 24.3% drop in conversion rate.
- Landing Page Conversion Rates: 2026 Benchmarks and 8 Tactics
Provided data on subheadline length and body copy length benchmarks, including the finding that pages under 100 words convert 50% more than longer pages in business services.
- 50+ Landing Page Statistics Every Marketer Should Know (2026)
Supplied the attention span figures showing decline from 2.5 minutes in 2004 to 47 seconds in 2024.
- How to Build High-Converting School Landing Pages
Provided the education-sector conversion data showing 13.3% for simpler language versus 6.4% for complex language.
- Landing Page Statistics 2026: 120+ Conversion Data
Provided the above-the-fold scroll data (57% desktop, 64% mobile) and headline performance figures including the 19% advantage of customer-language headlines and the 15% lift from concrete numbers.